Infographics and visual explanation
Information designed to beunderstood at a glance
I turn processes, data and technical ideas into visual explanations that help people understand the message faster across websites, presentations, campaigns and motion.
Who it is for
- B2B teams explaining technical services
- Marketing teams turning research into useful content
- Products that need clearer process or feature communication
What I deliver
- Information hierarchy and story structure
- Static and animated infographics
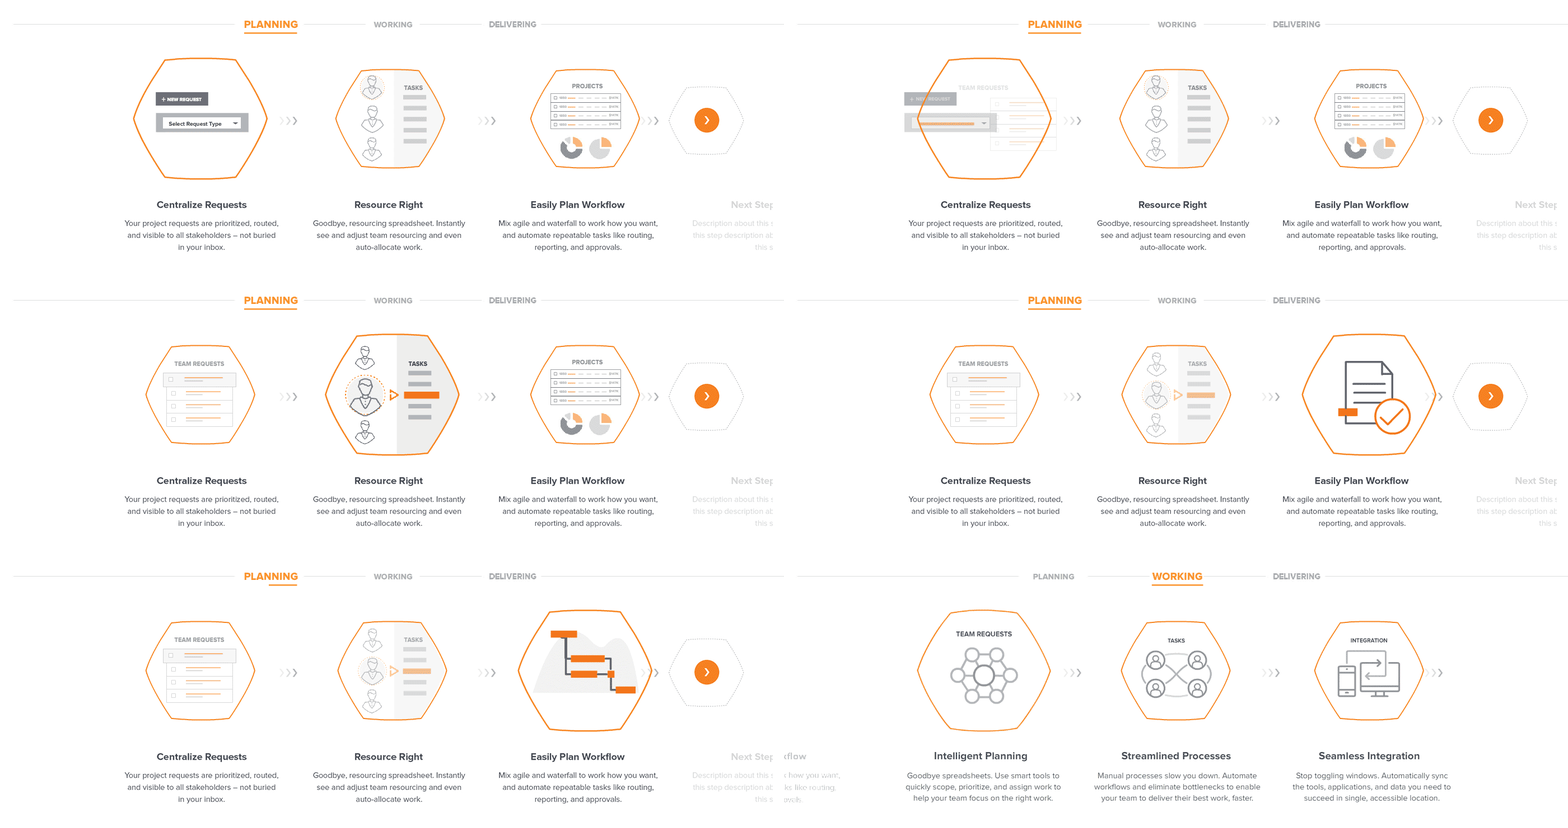
- Process and system diagrams
- Report and presentation graphics
- Web-ready visual explanation
- Reusable visual language for data
How I work
I identify the single idea each visual needs to communicate, then remove information that competes with it.
Structure, labels, scale and visual rhythm do the explanatory work before decoration is introduced.
Common questions
Can you animate an infographic?
Yes. Static information design can be extended into motion when sequence or change is important.
Can you work with supplied data?
Yes. The source information should be accurate and approved; I focus on hierarchy and visual explanation.